OMArk help

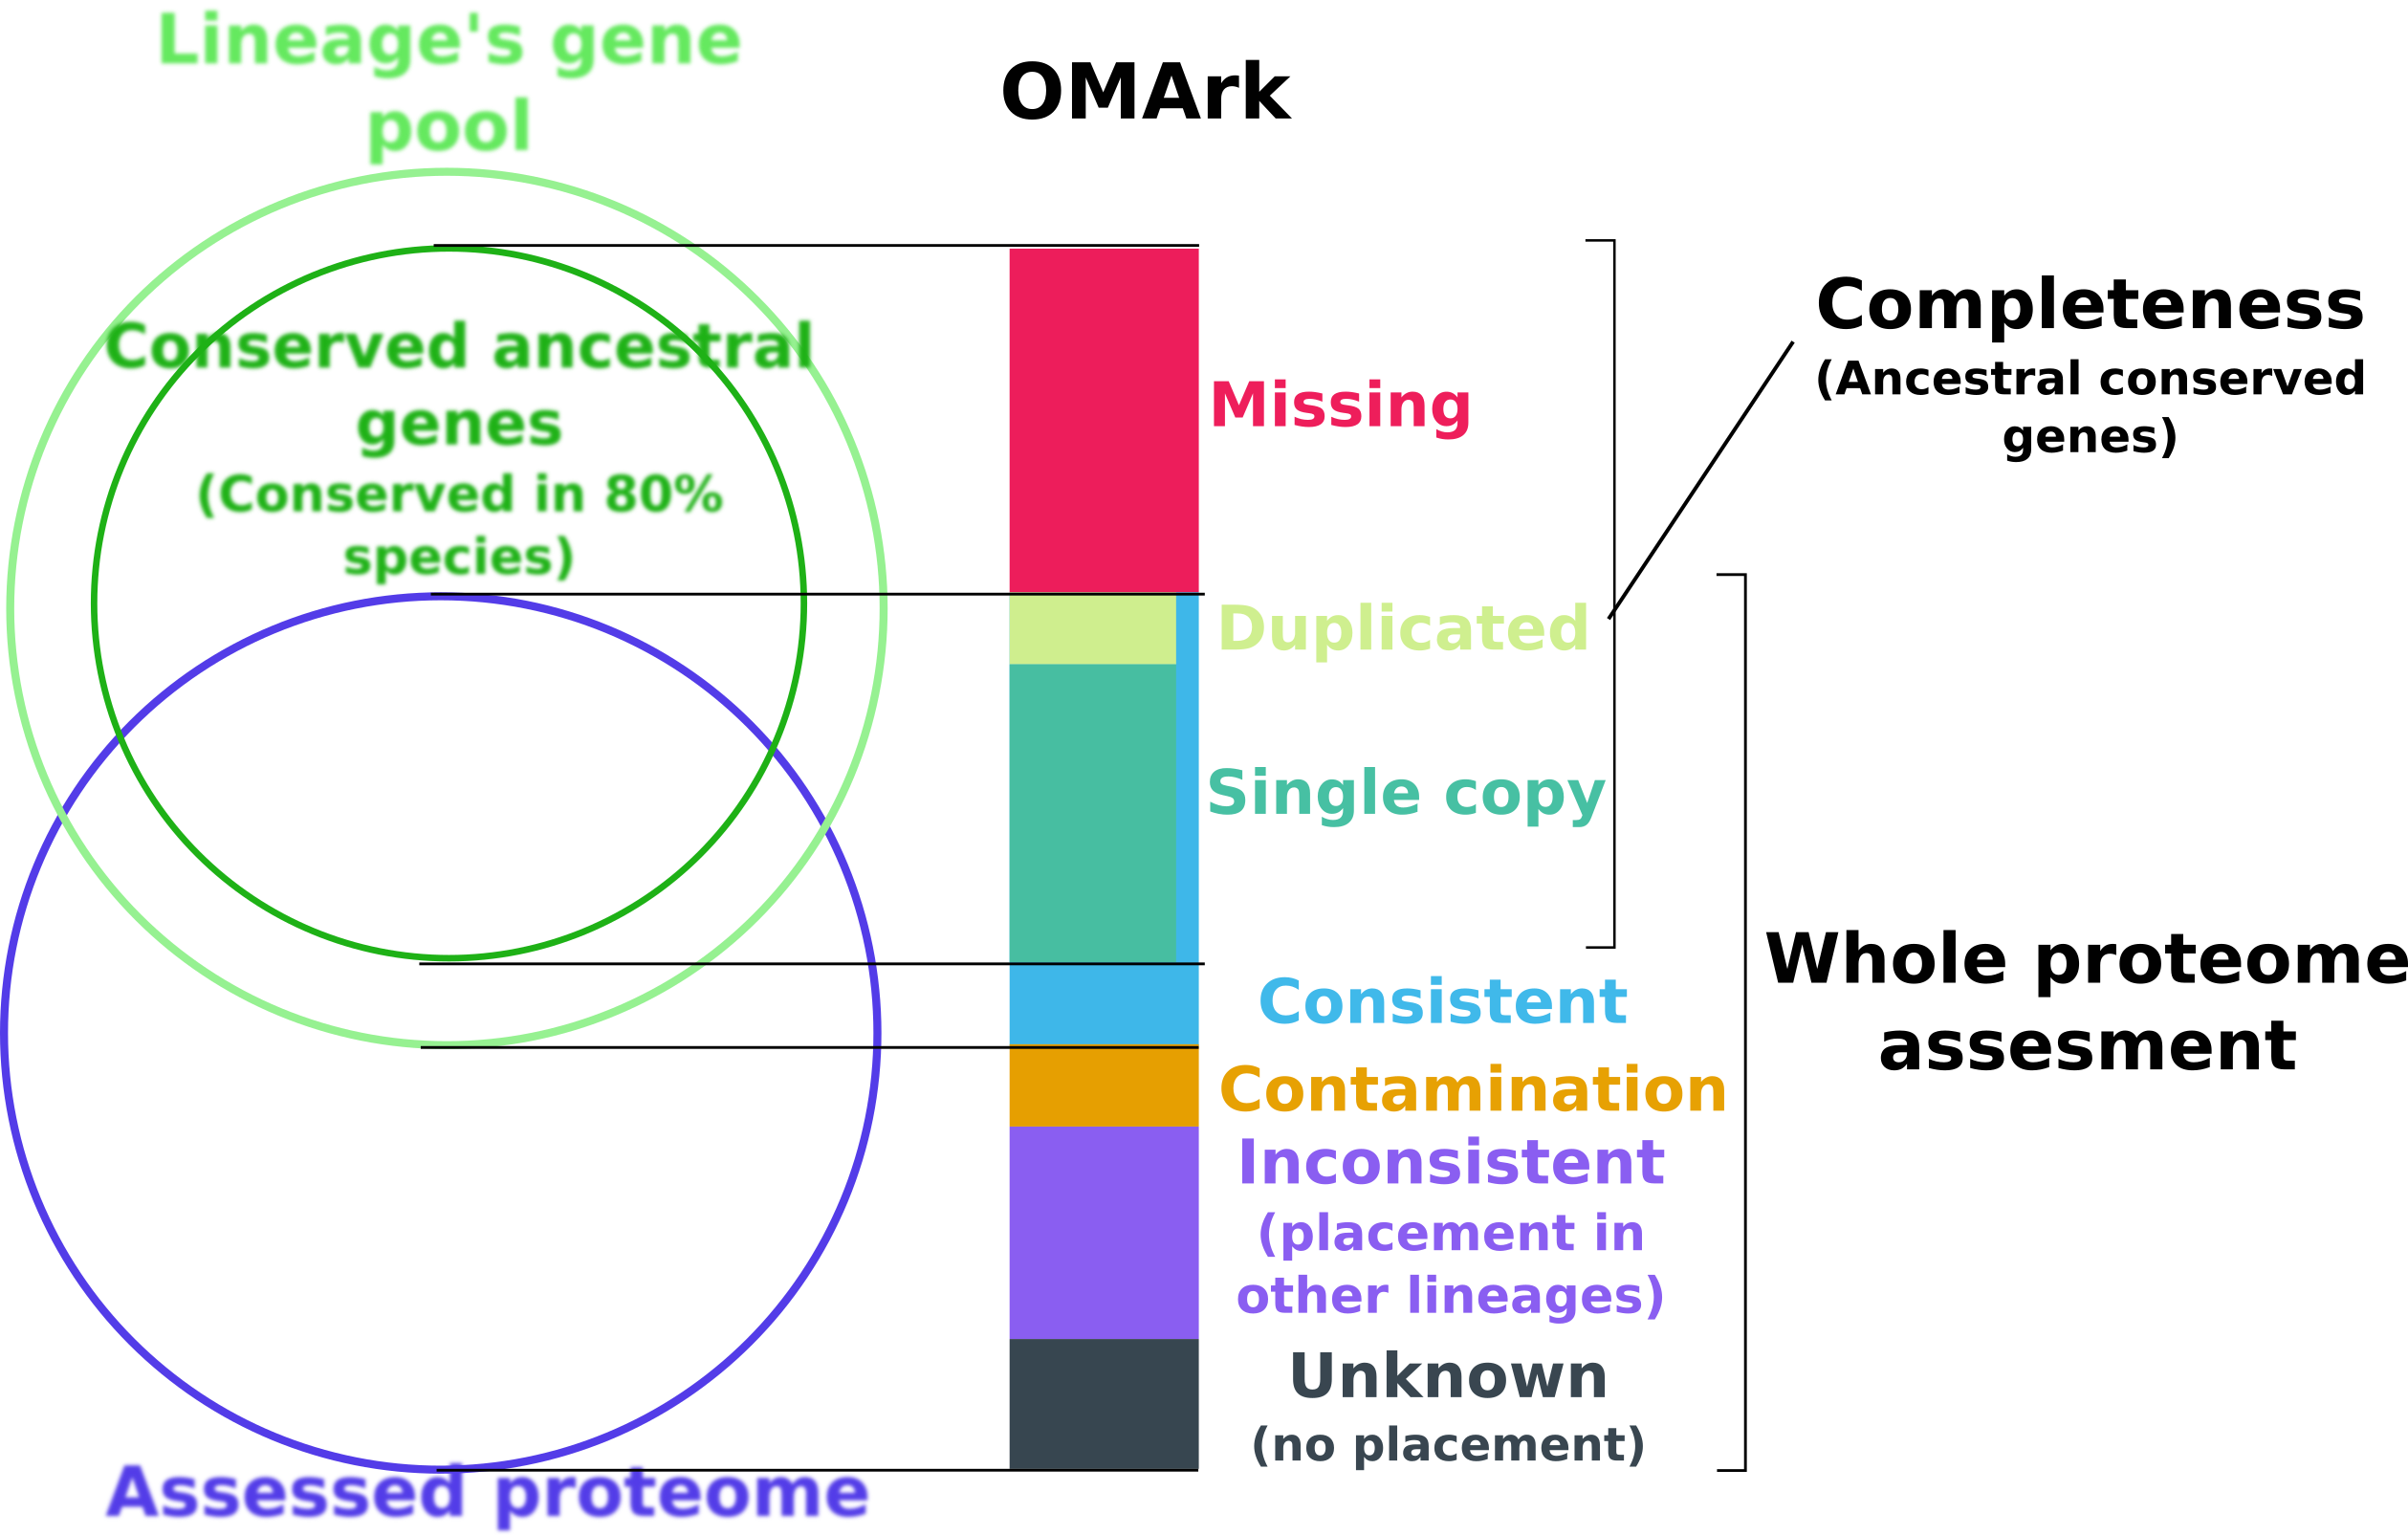
OMArk is based on the comparison of a target proteome to the expected gene repertoire of the common ancestor of a selected lineage to which it belongs, as reconstructed using extant species gene repertoire. OMArk results are divided in two sections: Completeness and Whole proteome assessment.
The completeness statistic is estimating what proportion of the actual gene content of the species is represented in the proteome. It does this by looking for representatives of conserved gene families (represented here as HOGs: Hierarchical Orthologous Groups) - gene families present in at least 80% species of the selected lineage and expected to be present.
The result represent what proportion of those HOGs are found or not in the genome, and are divided in three part:
- Single
-
The gene family is represented by one gene in the proteome.
- Duplicated
-
The gene family is represent by multiple genes in the proteome.
- Missing
-
The gene family is not represented in the proteome.
The Whole proteome assessment gives an estimate of the proportion of the proteomes made-up from gene models consistent with known homologs, and what proportion may be mistakes. It is based on comparison to the gene contents of all extant species of the same lineage from target species.
Consistent: Proportion of genes whose closest gene families are from the selected lineage.
Contamination: Proportion of genes whose closest gene families is from another lineage and likely come from contamination or horizontal gene transfer (Multiple genes are linked to representant of this lineage)
Inconsistent: Proportion of genes whose closest genes families is from another lineage, but likely result from noise (Likely dubious gene models/spurious annotation of non-coding region)
Unknown: Proportion of genes with no closest homologs found - could be spurious gene or orphan species specific genes
Genes from the three first categories can also be labeled as:
- Partial mapping
-
Genes that have less than 80% of the sequence with shared k-mer content from its closest gene family.
- Fragments
-
Genes with a length less than half the median gene content of its closest gene family
- Missing
-
The gene family is not represented in the proteome.
A high-quality proteome typically has a high consistent proportion, no contamination, and low partial mapping and fragments.
OMArk statistics are computed using the species distribution from the OMA database, thus sampling and diversity of a lineage will vary. Because of this, it is not advised to compare the results to those of species from different lineage, and is preferable to compare it to other close species.
The comparison view allows such comparison - as rules of thumb, a result would be considered as satisfying if it gets lower (or similar) missing proportion and higher (or similar) consistent proportion than species of the same range.
All proteomes displayed there were downloaded from Uniprot in February 2022